Comprehensive Fire Analysis in Water Distribution Systems
Previously, I wrote a post on what are the appropriate hydraulic modeling practices to simulate fire flow in a water distribution system (WDS) which you may find here. In this post, I’ll try to make a case for performing comprehensive fire analysis to fully understand the impact of your plan.
In most local watermain design and rehabilitation projects (i.e., pipe replacement, up sizing, or twining) one of the design goals is to improve the local fire flow capacity in the system. The common practice to evaluate the impact of the design on the system’s fire capacity is to consider couple of nodes where you expect to see the impact and check the available fire flow or residual pressure before and after the project is implemented.
The available fire flow is a flow that could be discharged from a hydrant while the residual pressure stays equal or above the minimum acceptable fire pressure (i.e., 14 m or 20 psi in most North American utilities)
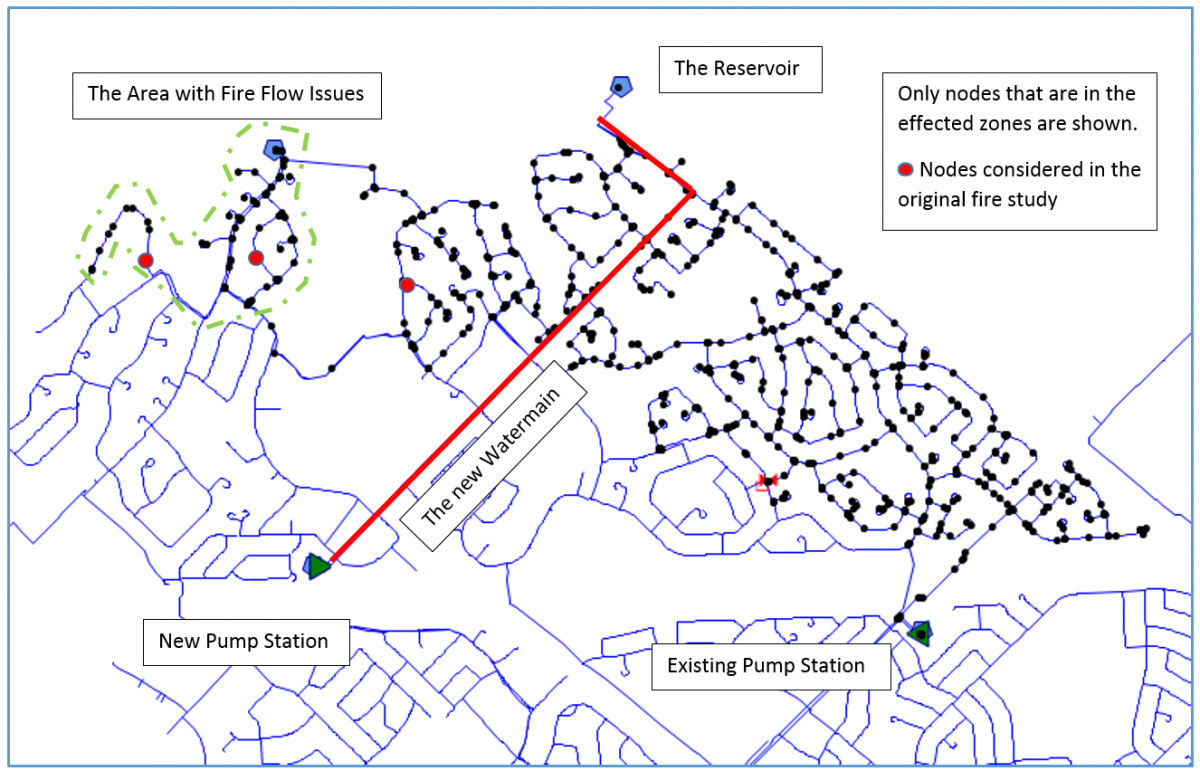
There are couple of fundamental issues with this approach. Limiting the analysis to just some random nodes and looking at their residual pressure could be misleading and prevent the designer from seeing the whole story and truly evaluate the system fire flow capacity. I’ll try to show this through a real project. Please note that, the project is anonymized for security considerations thus, names and numbers are changed and the background satellite image is not shown or obfuscated.
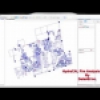
The original study considered three nodes in the system (shown as the red dots) and correctly calculated the residual pressure before and after implementing the watermain and concluded that the watermain will improve the fire flow in the area. This was due to the fact that the residual pressure will increase by 15 psi in those nodes. So far, everything looks good. But let’s run the comprehensive fire flow analysis on all of the nodes in this zone and see how the fire flow changes overall in the zone, to do so we are using HydraCAL fire analysis module..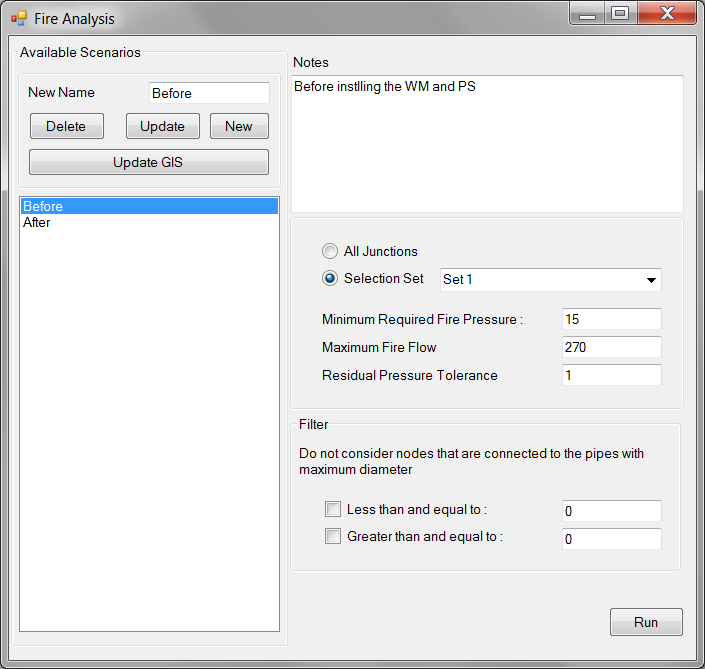
HydraCAL, uses proprietary methodology that finds the available fire flow for each node automatically. User only specifies the minimum residual pressure required during fire. The designer could also specify all or part of the system to be considered for the analysis and the program calculates the maximum flow that could be pulled out of the hydrant while the pressure stays equal to the requirement.
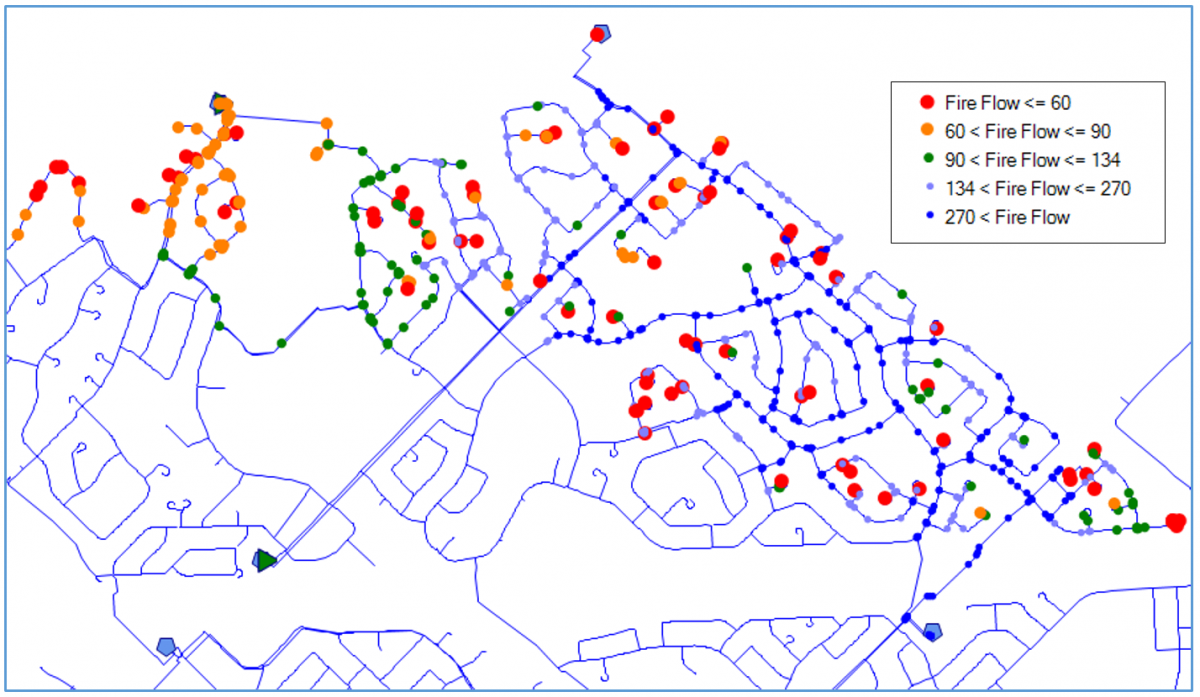
Let’s calculate the status quo fire flow. This is the available fire flow before implementing the Doe St. Watermain and the new pump station. The following figure shows the color coded map of the available fire flow before implementing the project. The results confirm that the area at west of the zone has indeed low available fire flow (i.e., mostly below 60 lps).
Now let’s repeat the simulations this time with the new watermain and pump station in service. The results are shown in the following figure.
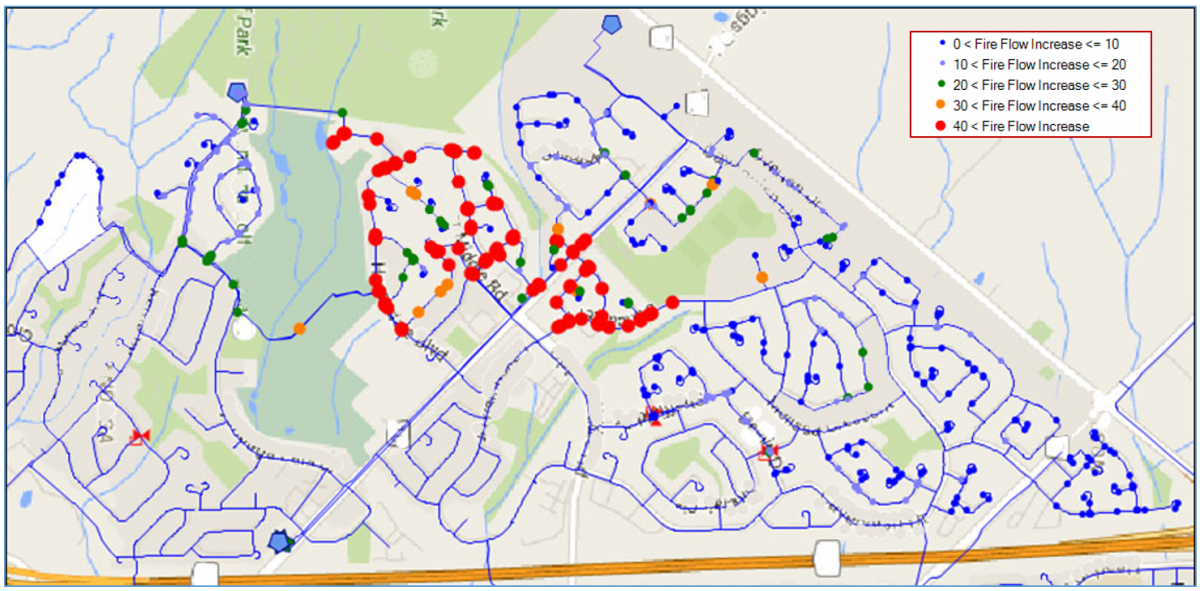
Although there are some limited improvement in the available fire flows, but it is very difficult to see where exactly in the system the improvements happened. To answer this question lets subtract the available fire flow before the implementation from the fire flow after the implementation. The results are shown in the following figure. As you may see the areas with low available fire flows west of the system benefits from the projects minimally (i.e., less than 10~20 lps) while the central area of the zone benefits the most (i.e., more than 40 lps). This was not possible to see if we were only limited to the initial three nodes (shown in the first figure).
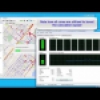
Let see why designers/engineers are still using limited number of nodes to evaluate fire flows and not the full system fire analysis. The main reason in my opinion is the fact that this process is time consuming. It would take four hours for software such as InfoWater to perform the fire analysis on this example system. For this very reason, HydraCAL’s fire analysis algorithm is designed for speedy calculation. It uses parallel processing and proprietary algorithm to speed up the calculation. It takes less than 5 minutes to do the fire analysis on above mentioned example system with HydraCAL. I believe it is worth it to spend five minutes and see the full impact of your design.
To prove how quick is HydraCAL’s fire flow analysis algorithm, you may send DataAb your WDS model and your fire flow requirements and we can provide you with the full fire flow analysis result (i.e., GIS map) for your system for free. Send us an email or call us.

